
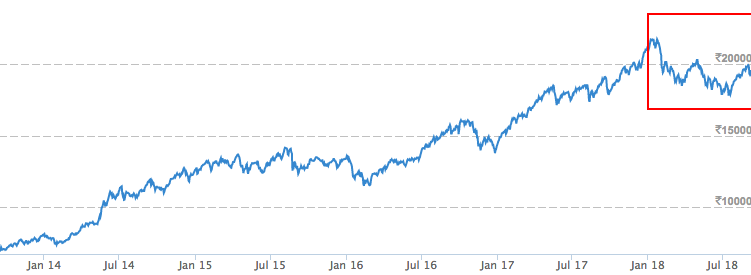
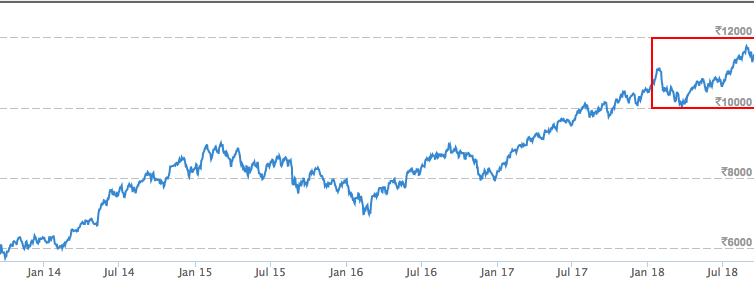
The mid-cap has had a terrific run from July-2014, starting around some ~2000 points on the index to around ~20000 now. Almost a 10X growth. The large-cap, on the other hand, has had a more stable growth curvature, having roughly doubled around this period. Let’s look more into optimizing stock portfolio now.
- 2018 has especially been a choppy year for Indian Equities sans the top 50. The difference in the performance of the NIFTY50 and NIFTY MID 100 is quite stark in nature.
- Also, on carefully observing the peaks and troughs, we see that we have similar movements on both the curves except during 2018.
NIFTY MID 100
NIFTY 50
Portfolio
I had started investing in late 2016, and ever since had a decent run at the markets until 2018 when the mid-cap broke down. This was largely due to two fundamentals mistakes. I ended up creating a mid-cap heavy portfolio with a very poor allocation of funds to the different stocks.
The underperformance has however made me question the risk management aspect of the investing process and the need for a sound quantitative way to allocate funds and go about the investing process.
- The stock selection aspect of the process can be continued to be based on fundamentals, ownership and upcoming business outlook. Low debt, high ROE, and reasonable P/E.
- The goal or intent of the experiment is to come up with a better way to allocate funds to different stocks in the overall portfolio aka the weights.
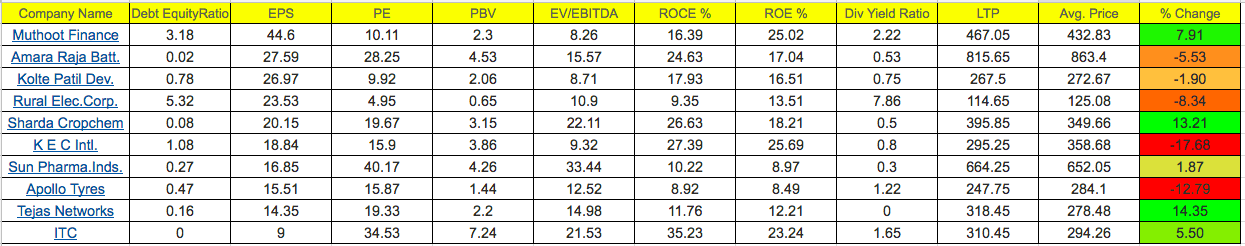
These were the set of 10 stocks, I had zeroed in on based on the combination of fundamental numbers.
- Some stocks deviate from the strategy of low debt but have other reasons such as good upcoming outlook(Gold loans), government-backed (REC) and so on so forth.
- I’m losing money on an aggregate basis due to poor portfolio allocation, which I intend to adjust.
Efficient Frontier Construction
The need was to construct an efficient frontier portfolio based on the past returns and volatility of these returns. This portfolio optimisation is based on Markowitz theory which enables us to optimise a portfolio’s return subject to the right amount of risk. We primarily need two sets of information :
- Returns of each individual stock. This historical returns data needed can vary depending upon the re-balancing frequency we intend to have for the portfolio.
- The covariance matrix of returns between the stocks. This is to diversify the portfolio by having uncorrelated stocks as possible.
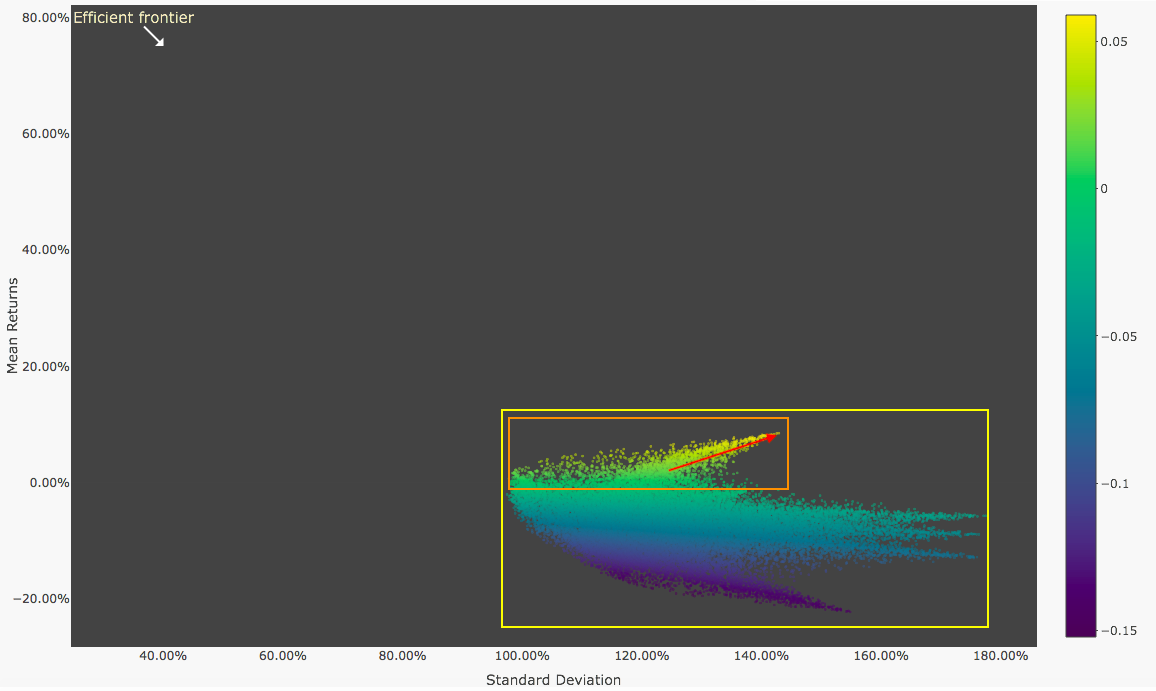 There are a couple of observations to make from the plot above :
- The yellow block shows all the random portfolio’s we made. Each dot represents a single portfolio with specific returns and corresponding standard deviation.
- The orange box represents makes the sensible choice since we intend to have positive returns.
- The red arrow points towards the efficient frontier, we have progressive returns corresponding to the increased risk in the form of the standard deviation of returns.
Efficient Portfolio Weightage
The efficient portfolios can be better visualised using a bar chart. The bar chart represents how weights change as we go about the portfolio’s across the frontier.
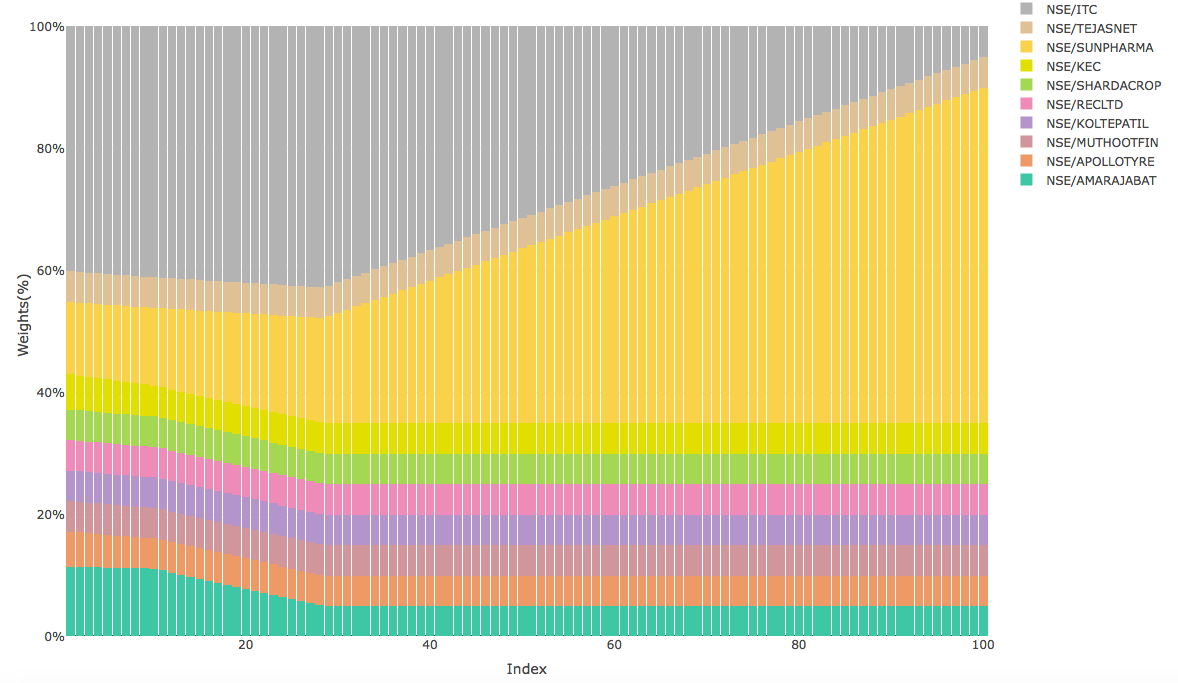
As we can see, the efficient frontier requires me to have a significant portfolio allocation in either ITC or Sun Pharma. As I increase my stake in Sun Pharma, I eventually increase my risk. Another interesting aspect is that my allocation in other mid-cap stocks remains fairly consistent. This smaller allocation in mid-cap is largely due to the high variance in their returns. Hope all this information helps you with optimizing stock portfolio.