
In the long run, there’s no luck in poker, but the short run is longer than most people know.
Rick Bennet
Not sure if the above quote makes sense but poker has come a long way and it would be great if we could be able to quantify the number short in terms of the number of hands and when does it become statistically significant. Poker Analytics has come a long way in terms of its application with HUDs and now GTO solvers which have brought complete game theory concepts to the forefront.
HUD Settings
There are multiple types of settings and data points possible on the HUD but one of the most useful ones has been the one with these basic settings along with stat descriptions.
- Have descriptions for stats. Gets difficult without them
- Have the following data points:
- VPIP: Basic Stat
- PFR: Basic Stat
- 3Bet (%): How wide the 3bet range is
- Agg:
- UOPFR:
- F3B (%): Those with high fold percentage can be 3bet extensively
- CBET_F & CBET: Some players have tendencies to either bet flop or turn a lot. Shows up really well
- CR:
- No of hands (#) : Colour coding after at least 50 hands allows a decent sample to begin with

You can probably add continuation bet of the river along with BB/100 win-rate to the HUD as well. Some strategies based on the HUD stats:
- F3B is high, you can 3bet bluff these folks with suited connectors a lot. This will however fail with a loose table where people will call with anything. You use a tighter range in that case.
- Some players like to make continuation bets on the flop and use such high numbers to continue with even okay or second-best hands.
- Call those with high turn bluffs
Hand Range Visualiser
As mentioned in the previous starter article about Poker Analytics, the game is fundamentally about what hands to play and how to bet them. There is plenty of content around on ranges and what kind of hands to open, bet and call.
Despite the availability of the info, there is a need to understand how much we end up following or complying with the range information. These games at micro stakes are anything but GTO.
The solution was a way to be able to visualise your opening ranges in terms of the typical starting chart. It would also be useful to know which hands to 3-bet, call and so on to get better with poker analytics. I decided to build this custom tool since it was not available on my HuD.
Visualise Your Range in Poker
The function when given starting hands take in whatever format BB or money can give a matrix in the standard format with strong, weak and marginal spots colour coded. These can further be broken down by whether you 3-bet or not, c-bet or not and so on. The charts can also be split by position.
This helps identify massive leaks in pre-flop strategy and the visualisation really aids in generating actionable feedback for the game. The performance of hand range from SB/BB (Small and Big Blinds).

- The junk hands are represented mostly by the orange colour as we simply don’t open these positions.
- AX and KX hands are massive leaks in this range.
- The dark greenish-blue are super profitable. The light green represents great spots too.
- Most of the great spots happen to be on the top left and the diagonal representing pocket pairs.
- Some suited connectors are also great bluffing spots and can occasionally flop nuts.
The story changes when we move to later positions of BTN/CO (Button and Cut-Off). The chart is a lot more sparse but much more greener.
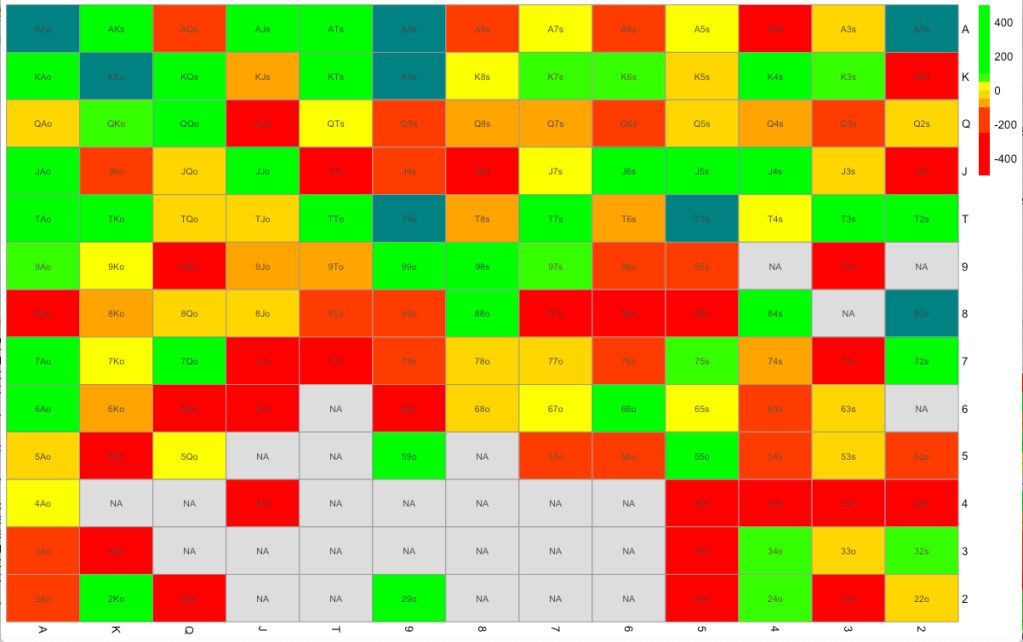
- The board is lot more polarising in nature with lots of greens and reds and almost no orange.
- NA represents the spots never opened by us. We should ideally be playing lot more tighter than this.
- J-suited and QJs seem to be trouble spots and need to be more carefully played out.
- The very green spots can be 3-bet regions.
We can slice and dice the data/hand history we use for the generation of these charts thereby helping us identify the leaks in a sharper manner.
One of the major recommendations for poker is to play tight. Visualising the opening charts by position will help verify if that’s indeed what’s being done by you, like lots of spots that look like good hands such as AJ and AQ can be seen to be troublesome if not played appropriately.
Bet Sequencing
The other major issue was how was my betting worked across the different streets (Pre-Flop, Flop, Turn and River). I was missing lots of value on the river checks which was an observation by one of the fellow players and thereby validated using data.
To further evaluate and verify this observation, I decided to extract the bet sequences from my hand history and whether I took the pot or not. It does consider the starting hands or board texture but still is incredibly insightful when aggregated over a large sample and gives sequences that are most profitable and ones that are not.
As can be seen, a lot of checks on the river where I was gaining a lot more value over losing it and should have a value bet a lot more on the river which would have improved our game a lot more.
- The value has been tracked in terms of BB/100 hands.
- Most of the profitable ones need to be starting with raises instead of calls, though we have a few of them as well.
This would have been interesting to know where we played what sequence and from which position, it would be quite likely that calls are from the late position while raises can be from both kinds of positions.
River Calling in Poker
The other big question was to differentiate between bluffs and value bets on the river. Based on my showdown stats, it was observed that most value bets were pot-sized and bluffs were half pot.

This is stats or plot is going to different for each player and their tendency in the game and stakes. But it’s a good idea to visualise some of these questions to better understand leaks in the game and improve your poker analytics skills.
Other custom analytics, which is possible:
- Opponent Analysis: Using their river bet sizes to determine bluffs vs Value
- How is your profitability with different percentage of opening ranges?
And so on …