
Going beyond the conventional portfolios and developing state-of-the-art strategies that comply with the ever-changing financial and technological advancements are the keys to long term sustainability. So here we are discussing about optimizing cryptocurrency portfolio.
It seems the heydays of cryptocurrency is behind us with the Google search volume showing a stark decrease in interest ever since the crazy ending of 2017.
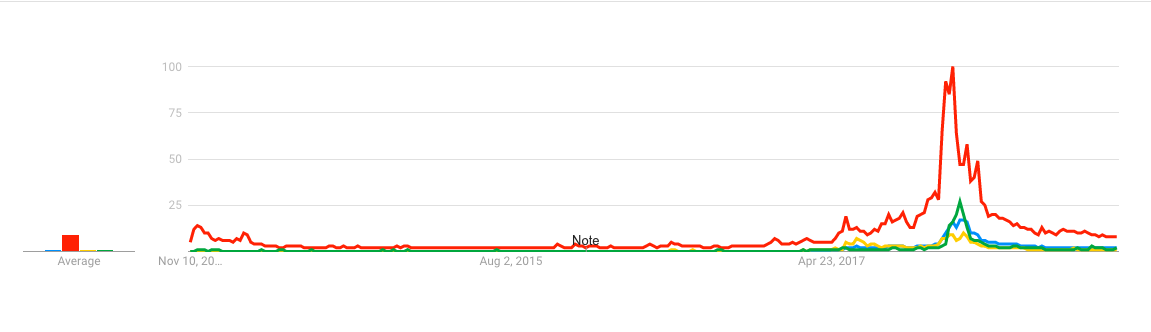
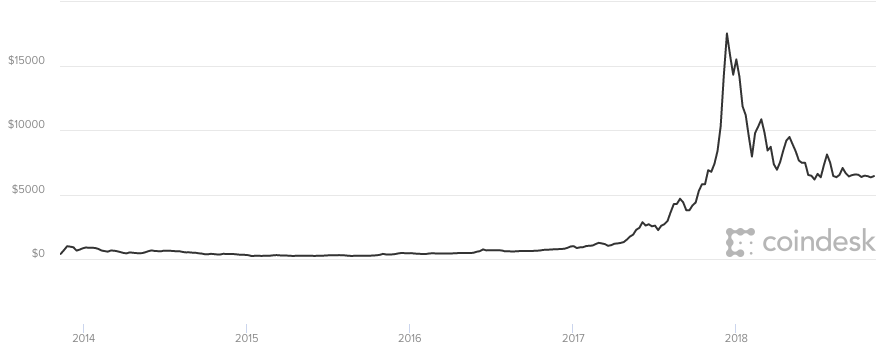
The sharp spike and its eventual demise look very similar to a middle finger salute, though it will be a while if crypto ever reaches those levels back again. Even the price seems to be following a strikingly similar pattern with the search volume.
Portfolio
Given the situation, while crypto-investing seems to be a bit out of fashion, for those still HOLDing, I wanted to know if we could come up with more optimal weights to different cryptocurrencies in the portfolio.

I divided the coins into different sets based on their relative interest and volume of transactions. This is a very subjective call but then this is my take on the three sets.
I will leave it up to people on how they would want to allocate their weights to the 3-categories but using Markowitz efficient frontier, we can arrive at optimal weights within each category.
Efficient Frontier Construction
Furthermore the need was to construct an efficient frontier portfolio based on the past returns and volatility of these returns. This portfolio optimisation is based on Markowitz theory which enables us to optimise a portfolio’s return subject to the right amount of risk. We primarily need two sets of information :
- Returns of each individual crypto-stock. So this historical returns data needed can vary depending upon the re-balancing frequency we intend to have for the portfolio. Also, I had data only for a specific 2-months so, this will be the only history used.
- Lastly the covariance matrix of returns between the stocks. This is to diversify the portfolio by having an as diverse combination of crypto-stocks as possible.
A sample frontier creation displayed below:
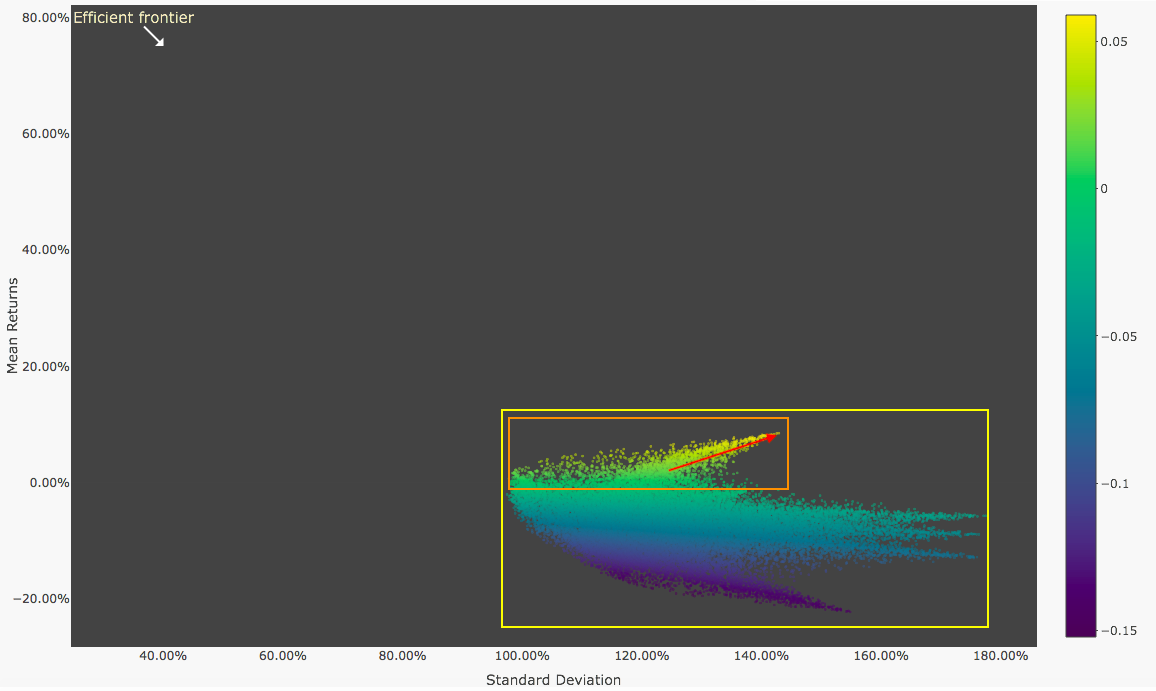 There are a couple of observations to make from the plot above :
- The yellow block shows all the random portfolio’s we made. Each dot represents a single portfolio with specific returns and corresponding standard deviation.
- The orange box represents makes the sensible choice since we intend to have positive returns.
- The red arrow points towards the efficient frontier, we have progressive returns corresponding to the increased risk in form of the standard deviation of returns.
Efficient Portfolio Weightage
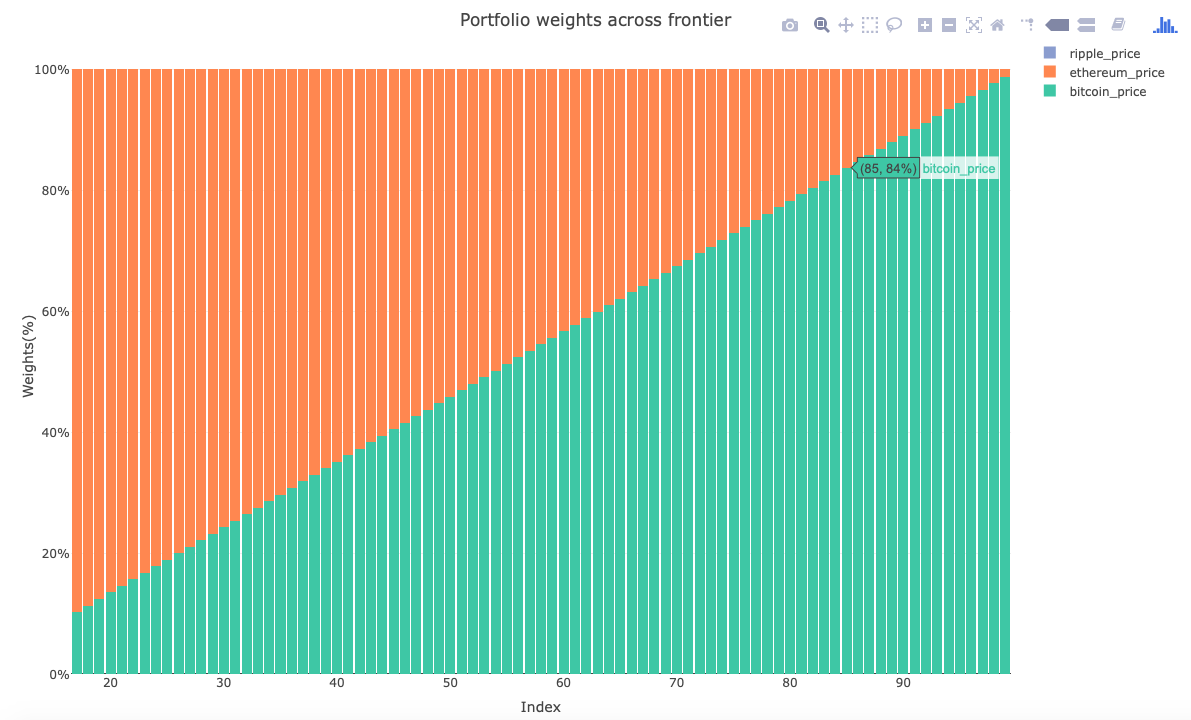
The efficient portfolios can be better visualised using a bar chart. The bar chart represents how weights change as we go about the portfolio’s across the frontier. From left to right, the portfolio’s reward rises as does the risk of investing.
First Bucket
The distribution here is interesting because the efficient frontier suggests zero allocation to ripple across any of risk-reward combinations. So, the allocation in bitcoin increases as we seek greater returns at greater risk.
Third Bucket
We get an even interesting distribution here with a lot of weird intersections with Waves, Qtum and Stratis find zero allocation in this case.

The second category was giving funny results and I will need to understand it a bit more, but this is for the above two categories. Lastly, let me know what you guys think.
References & Tools
- Reference Blog (Code)
- Efficient Frontier (Intuitive)
- Efficient Frontier (Paper)
- Plotly
- Machine Learning: Quant Finance
- Get Trezor
If enough people want to have a simple web interface to do the above calculations for Optimizing Cryptocurrency Portfolio , you can reach out to me. I will put up a web-service.