
The last few months especially the 6 have been fairly volatile and difficult times for the Indian Markets. The post-election budget, trade wars and slowdown concerns have made sure your mutual fund portfolio has bled quite a lot
Optimal Portfolio Tool
- Give it a couple of minutes to load. Gives you ideal portfolio based on look-back period.

The fact that my mutual fund portfolio, like many, was a random collection of different funds without an understanding of what the purpose of each fund was. I decided to reboot things a bit and put a band-aid on.
Over the last 2-3 odd years, I learned quite a lot including the miss-selling prevalent in the mutual fund industry. Anyway, I recently pruned out the number of mutual funds from over 25 different folios to roughly 8. The pruned ones including duplicate folios with weaker performance etc.
Allocation scheme
Given the churn in the market, it’s important to have a well thought out allocation scheme which includes Cash, Gold, Debt and Equity. Here when I mean Debt and Equity, I mean Debt and Equity Mutual Funds. Some people have started to hoard on Cash to prepare for the coming times.
- I decided the ideal allocation percentages based on the last 6 months of volatility.
- My understanding is that, going forward we are likely to see things proceed in a similar direction and the volatility to continue.
- Cash is also a part of the portfolio, I tried to understand the performance vis a vis USD. So, it’s returns are computed using the exchange rate.
- In addition, the 8 chosen funds are of different type and reflect all the possible types of mutual fund instruments available.
The 8 mutual funds are:
- Kotak Gold Fund (G) (DSP World Gold Fund is not recommended anymore)
- Axis Banking & PSU Debt (G)
- Mirae Asset Emerging BlueChip (G)
- Parag Parikh Long Term Equity Fund (G)
- HDFC Small Cap Fund (G)
- Invesco India Contra Fund (G)
- SBI Nifty Index Fund (G)
- BNP Paribas Mid Cap Fund (G)
The Process
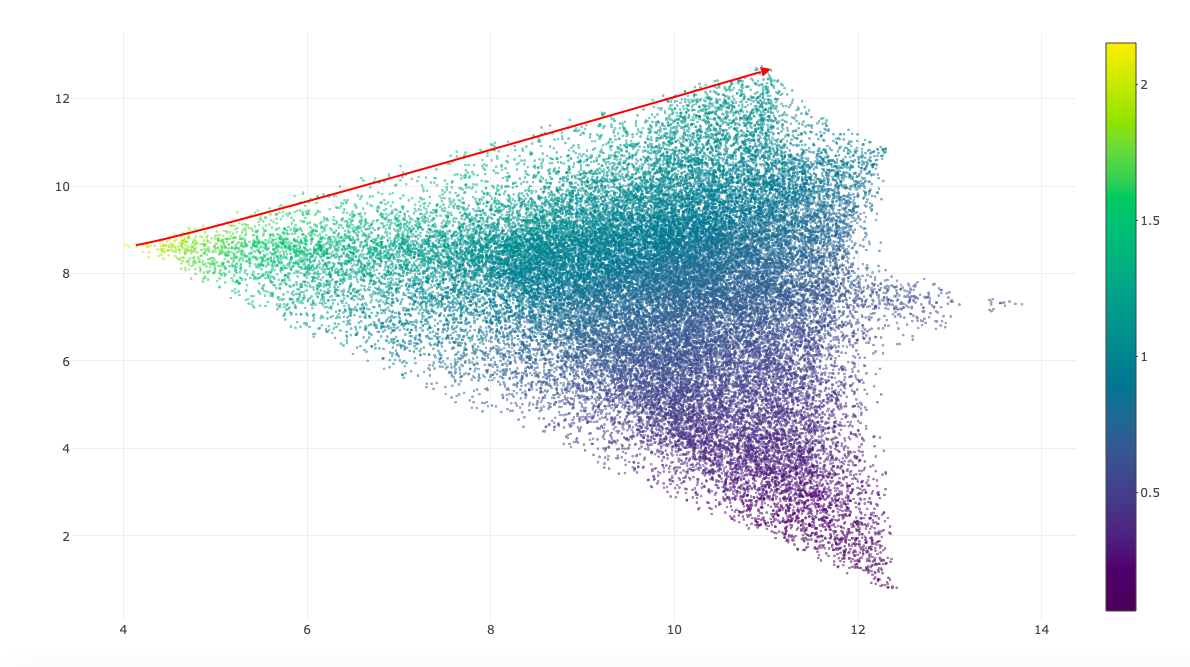
Let’s try and understand what exactly did we do here:
- The arrow points towards the efficient frontier and the Y-axis has the annualised returns for this portfolio.
- The X-axis is the annualised standard deviation for the portfolio.
- The portfolios across the arrow are the ideal ones. This is because we get greater returns for the additional risk defined as standard deviation here.

I allocated a minimum of 5% to each type of mutual fund to maintain some minimal diversification at the cost of performance and anything beyond that needs to be earned.
- All allocations except Gold and the Debt fund receive the minimal 5%.
- The frontier lies along with a combination of Gold and Debt. Greater your gold allocation, greater the risk and returns.
- The lowest returns one has Debt (Axis) at 39% and Gold at 26%
- The median portfolio has Debt (Axis) at 22% and Gold at 43%
- The highest returning portfolio has Debt (Axis) at 5% and Gold at 60%
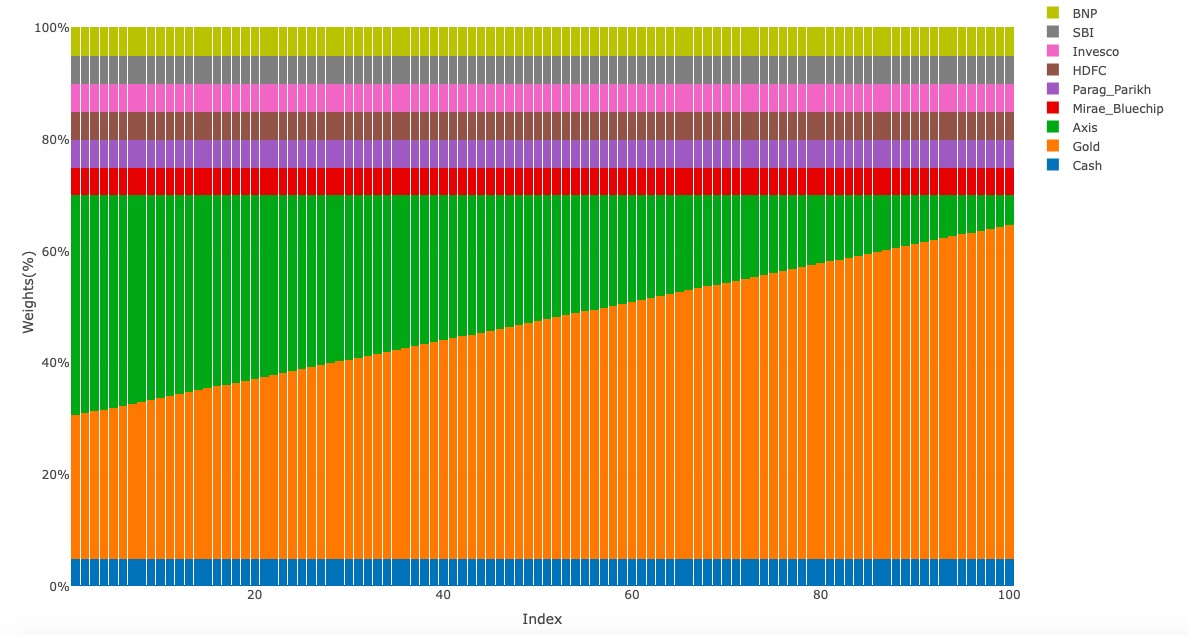
What do you guys think, I know the portfolio is heavily biased towards Gold due to the nature of data with Gold in last six months going complete bonkers but even the most conservation portfolio has it being at 26%.
But how did a similar do six months back? The frontier constructed 6 months before:
The ideal allocations six months before?
- The ideal allocation at that time would have binged on completely on the Index.
- The other allocations limit to a minimum of 5%.
- Use the below tool to check weights between Index, Gold, Debt & Liquid Funds (Cash).
Conclusion
Thus our portfolio depends a lot on what we expect to happen over the next 6 odd months. The recessionary portfolio is only relevant and valid for the upcoming volatile time. Once we see through it, this will need to be re-vamped.
- I plan to re-allocate based on this conservative portfolio of 39% Debt, 26% Gold and the remaining 30% in Equity. I expect things to remain the same or get more severe thereby the allocation.
- In case, the ideal portfolio is one the involving 65% to Index mutual fund and the other 35 % is allocated equally among the 7 other folios.
Any other time frames or comments regarding the above are welcomed. A detailed link to code and other sources is mentioned in a similar blog below
Tool for Mutual Fund optimise
- Give it a couple of minutes to load. Gives you an ideal portfolio based on look-back period.
Edits
- Edit 1: This article was written in early October 2019 and since then the portfolio has done really well delivering 3.87% as of Jan first week 2020. For help getting these weights for your personal portfolio, reach out to me.
- Edit 2: The portfolio is at 5.18% as of Feb 3rd, 2020.
- Edit 3: As of 4th April, we are down 2.72%. This is pretty decent compared to equity funds which are down 30%. However, fared tepid against cash. But the expectations are that Gold will payoff soon vis a vi Cash.
- Edit 4th: As of 16th April 2020 the Portfolio is now in the green (2.22%). Gold is doing the job !!
- Edit 5th As of 3rd June 2020. We are at 3.5% again.
- Edit 6th As of 28th July 2020. At a solid 11%