

The featured infographic is a survey conducted on Indian demographic using a survey tool by JustFacts !!
I have been following the Mumbai Rental space for housing since the recent move and have had a hard time understanding the different variables at play and how they influence the housing price here. The high rents and very opaque pricing is very confusing.
Show me the Rent
The question is how to go about finding a place, decide on rent and which site will help us the best?
There are at-least 4 popular sites and go about the process in different ways:
Google Trends
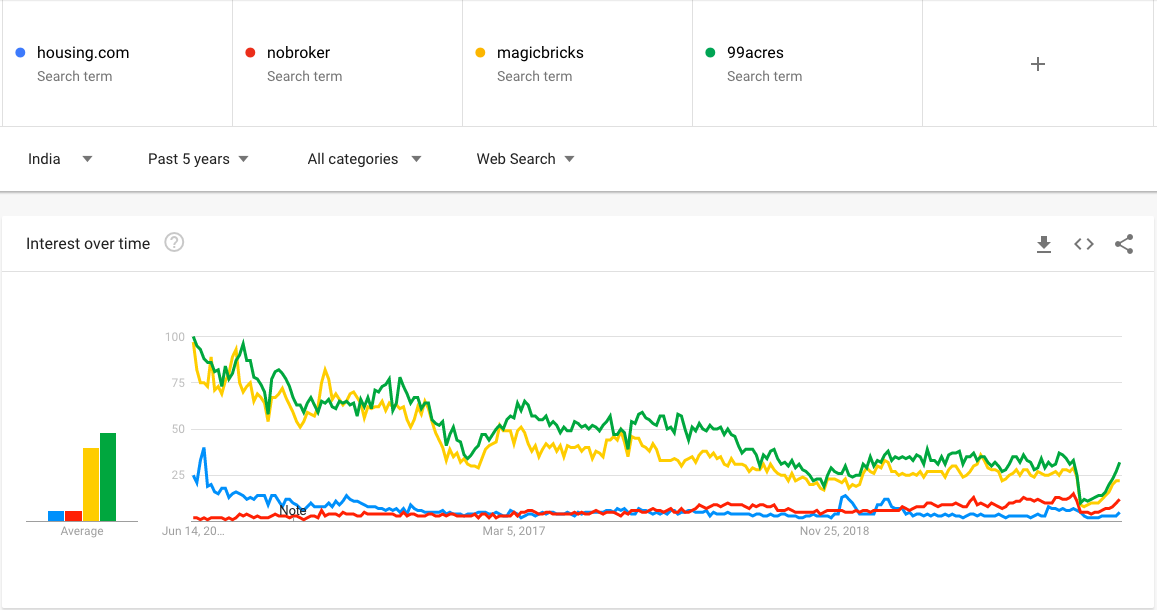
Magicbricks and 99acres seems to be loosing ground to Nobroker and Housing is limbo state. These trends at-least validate NoBroker’s claim of better user experience due to missing brokers. Magic bricks has a headache inducing design.
MagicBricks

99Acres

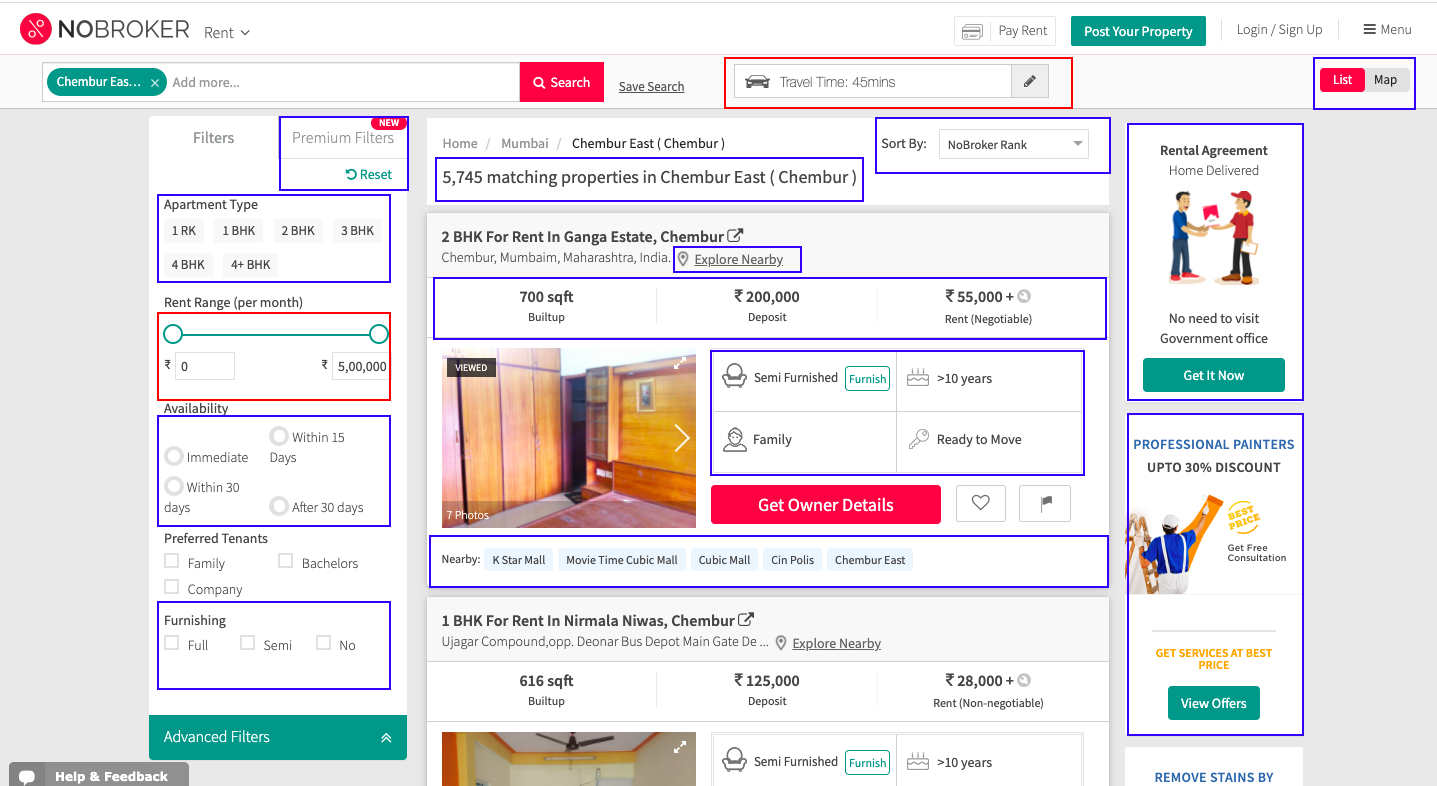
Nobroker definitely has upped the other two due to elimination of brokers but their user experience in terms of searach and number of decision point thrown at your face continues to be an issue. There are easily some 15+ data points/nobs to move around.
NoBroker
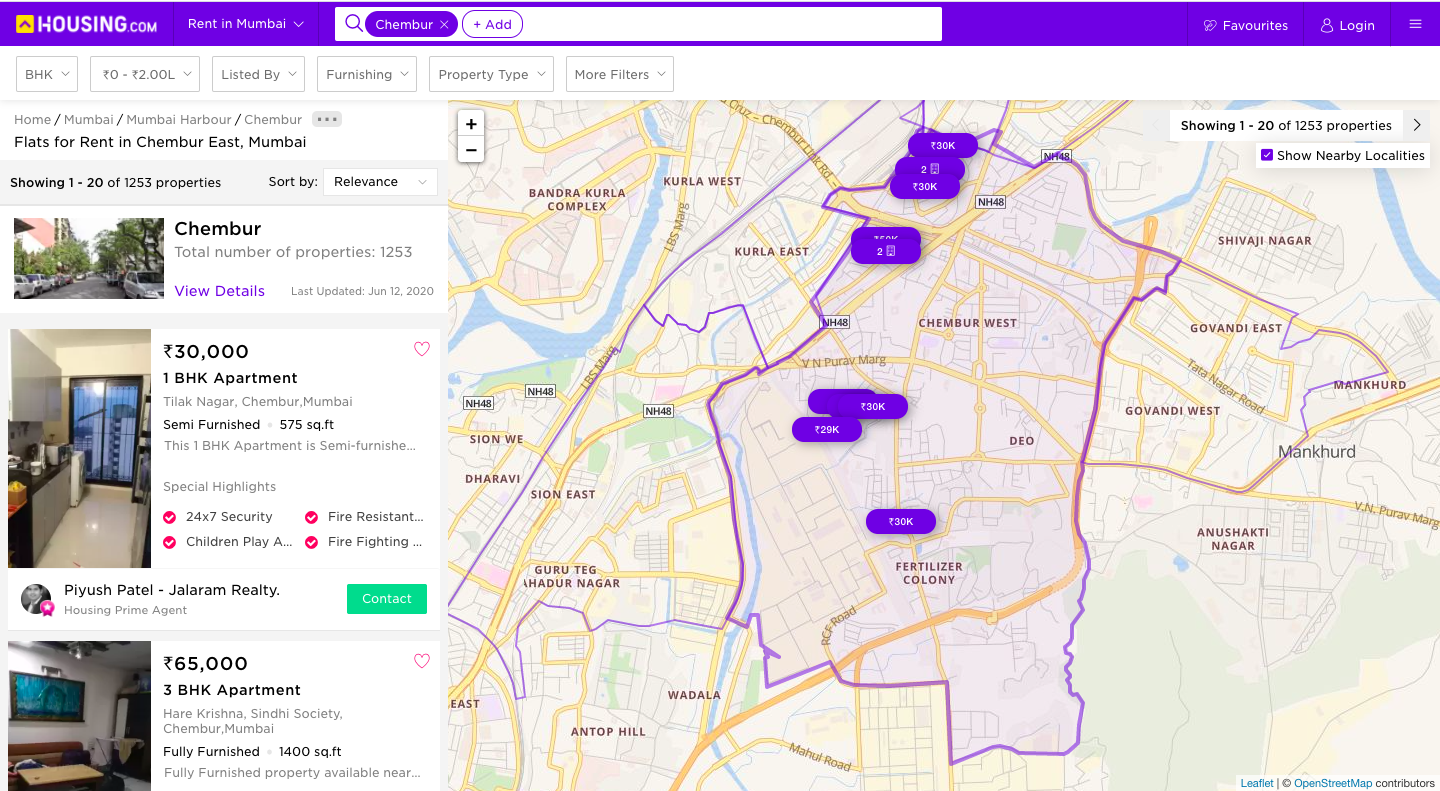
Housing.com seems to be better designed software and a cleaner interface with very good design. It looks very similar to my existing dashboard. This still does not answer the question though, is my rent fair?
Housing.com
The reality is despite having huge data base, as a user you can only look at a very small subset of the data and the poor product experience wastes time in terms of experience. At-least no broker allows you to evade brokers. I decided to get some data from the FB groups.
I ran a small experiment using 300+ houses-data points collected over a couple of weeks posted randomly. While not completely comprehensive, this gives a few pointers to help answer one question, is the Mumbai Rental price fair?
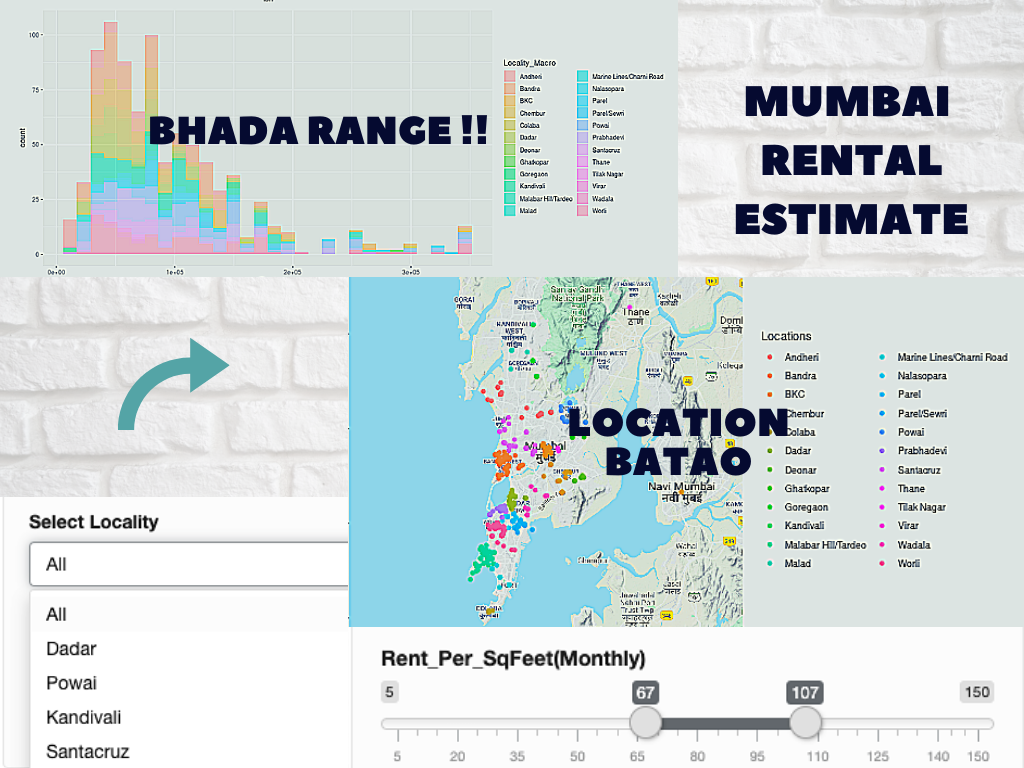
Location vs Price Adjustments

Cheapest to Most Expensive(Top to Bottom)
This was the previous version of Mumbai Rental, based on the 300 + data points. The whole exercise invited some creative expletives from people. The restricted data and some mislabelled locations threw off the inference from the data.
Luckily, I got access to some richer data set thanks to Dr Karan Barpete. The data set was larger and better collected. This was pre-COVID and thereby rents need to be seen in that context.
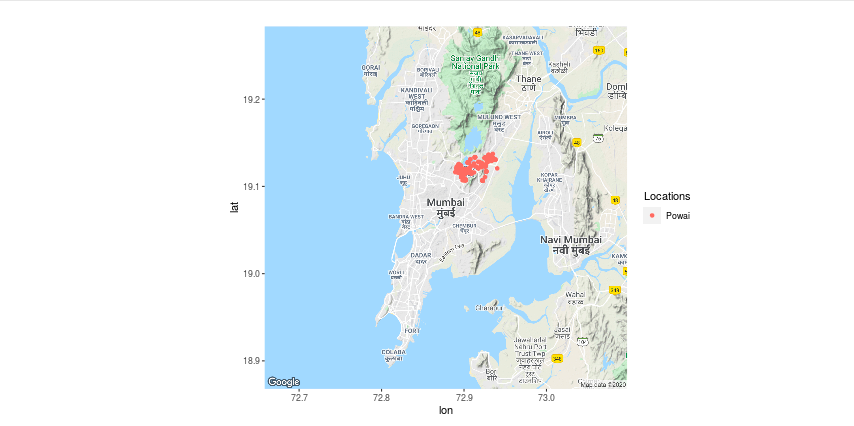
- The data is rich containing over ~12,000 data points. It had latitude and longitude information available. This allowed me to cluster the locations based on these instead of the mentioned locations (this can be a bit inaccurate due to a myriad of reasons: ignorance and deliberate misdirection).
- Created 50 clusters and assigned them the location with the largest occurrence. This is more accurate and corrects for mislabelling.
- This was better both in terms of volume and mislabels were dealt with by automatically correcting using ML (Clustering in this context using lat-longitude)
Input Levers
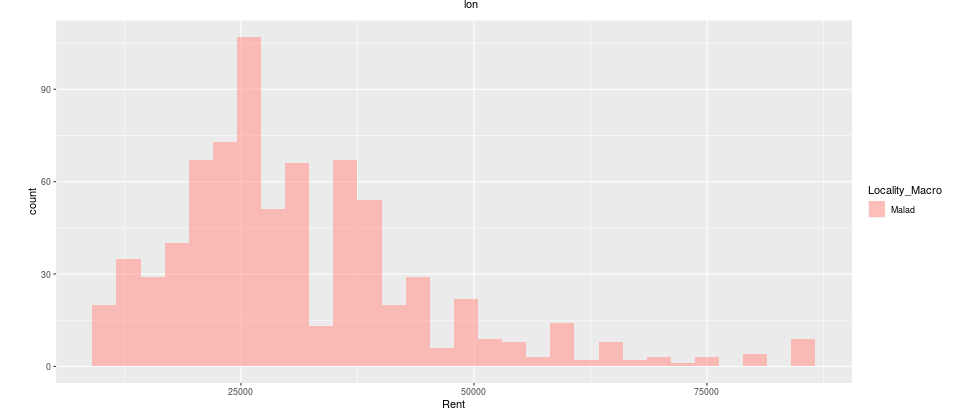
- You can adjust the data displayed on the map based on rent per Sq-Feet. Instead of relying on the size of the house in terms of 1 BHK or 2BHK and so on. I simply considered the Sq-Feet to compute the ratio Rent/SqFeet.
- You should also be able to select a location based on the dropdown.
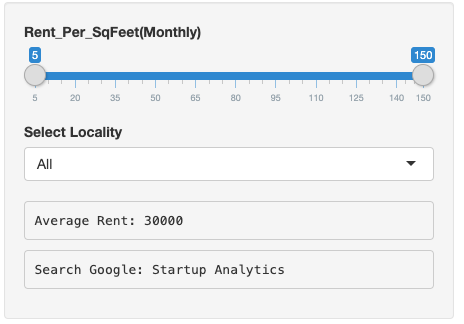
Output Displays
- Average Rent is simply the median rent from the whole cohort selected. This is kind of an anchor price for you to refer to. The other label is some advertising. One of the main display’s on the right is the Map. You will be able to look at plots for the only specific locations chosen.

- The display on the bottom right, allows you to check the distribution of the rent. This is useful to be able to understand the price range and how rare or frequent the corresponding rental is.
Give the tool, a minute or two to load when you open the site for the first time. The graphs can be pretty intensive to render.
Show me the Rent
ggmap: https://journal.r-project.org/archive/2013-1/kahle-wickham.pdf